
EcoTiM Results
The model reproduces the annual signal of the main nutrients as well as the variability within a tide. The gradients in the nutrient concentrations from higher values near the coast to lower concentrations offshore are reproduced by the simulation.
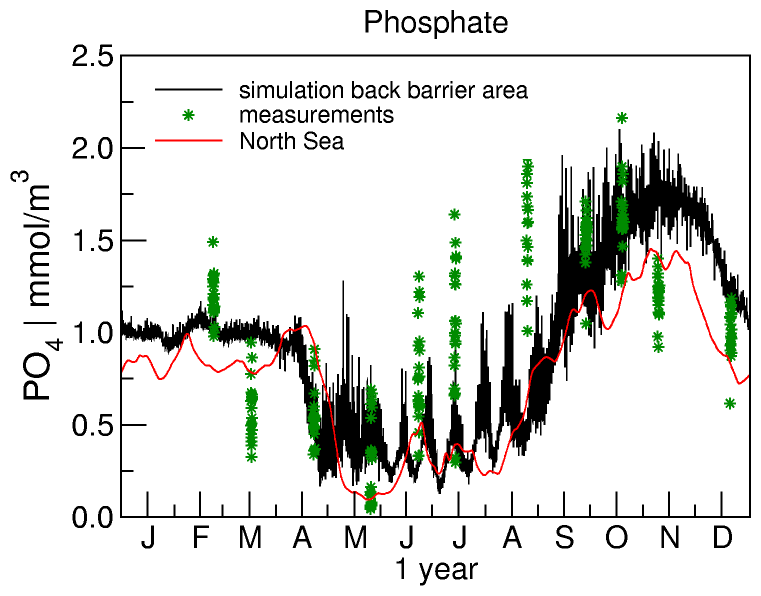
Simulated phosphate concentration in the back barrier area (black) compared to measurements (green, Liebezeit: unpublished data). The red line denotes the boundary condition of the North Sea.
The model allows sensitivity analyses on scales from several years down to some hours. Nutrient and organic matter concentrations, the abundancies of primary and secondary producers and bacteria in the pelagic and in the benthic system may be investigated. The estimation of mass flows and productivities and the investigation of extreme scenarios as storm tides and ice winters is possible.
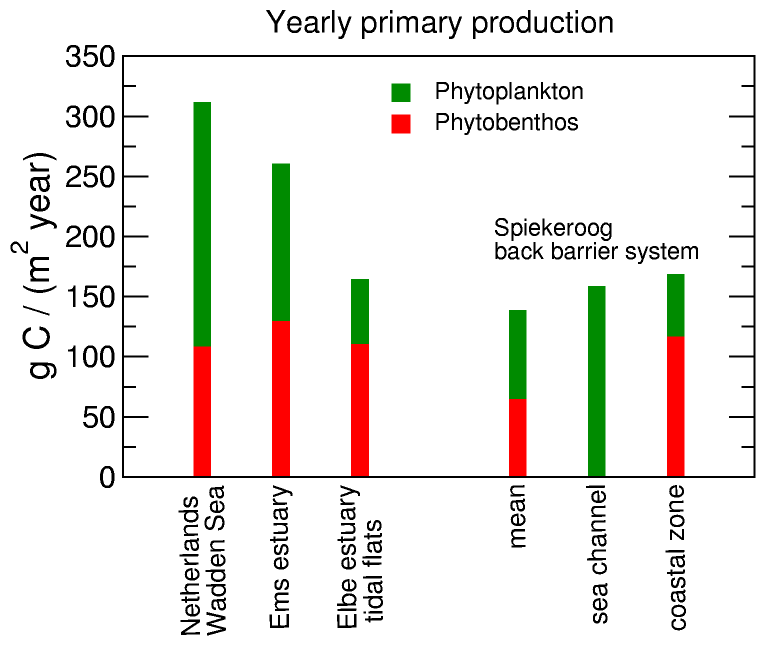
Yearly averaged primary production for different geographical regions as denoted in Elbrächter et al. 1994 compared to the simulations of EcoTiM for different regions within the back barrier system of Spiekeroog. The part of production due to phytobenthic activity is marked red.
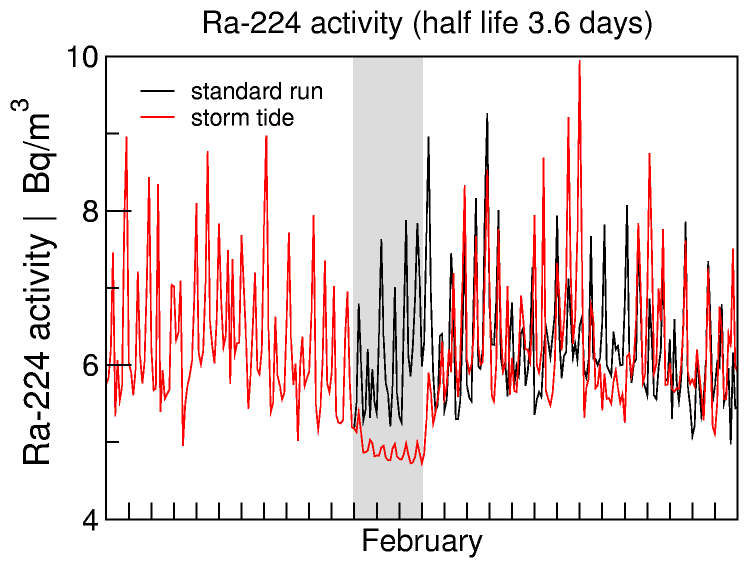
Simulated Radium-224 activity within the back barrier system. The black line shows a ''normal'' situation, the red line a storm tide. The duration of the storm is marked grey. The activity decreases during storm due to incoming sea water and due to the increasing sea level within the back barrier area. This leads to a relatively smaller impact of the benthic efflux.